As you've probably guessed by the title of my article, I still consider Ruby on Rails as a relevant technology that offers a lot of value, especially when combined with ReactJS as it's frontend counterpart. Here's how I approach the topic.
It doesn’t matter how easy programming language is to use, it’s very likely that sooner or later we encounter some bugs in our code. Luckily, Rails provides many useful tools which can help us to deal with them.
In this post I’m going to look through four interesting debugging tools:
- Active Record Backtrace SQL Queries Plugin
- Logger
- Byebug
- Pry-Byebug
With help of Logger, Byebug, and Pry-Byebug, we will fix the same problem, so you don’t need to read the whole tutorial if you’re going to use just one. Using Active Record Backtrace Plugin is also worth seeing, additionally.
However, I will show you all of the different ways of usage for debugging things to allow you to discover your own preferences easier and show you the different ideas behind debugging.
General tips
Before focusing on real examples, here are some general tips that should be used before beginning any debugging.
1. Always read error messages.
Carefully reading error messages may give us essential information, which allows us to understand what a problem is, including: what class/method does the error reference, what is the class/type of the object, if object is nil, if you call a method on this class/type of object, or what lines of code should be investigated.
2. In the stack trace, pay close attention to the code lines that come from your project.
There are lines starting with app/… . In most cases, your own code generates a problem.

If you already know this, we move on to Rails debugging.
Ruby on Rails Debugging
Below is a page from an application that isn’t working correctly, and we’ll try to fix it. There is a list of clothes with prices, sizes, and categories that they belong to. The application must be able to lock the chosen size of clothes, which is not in the inventory.
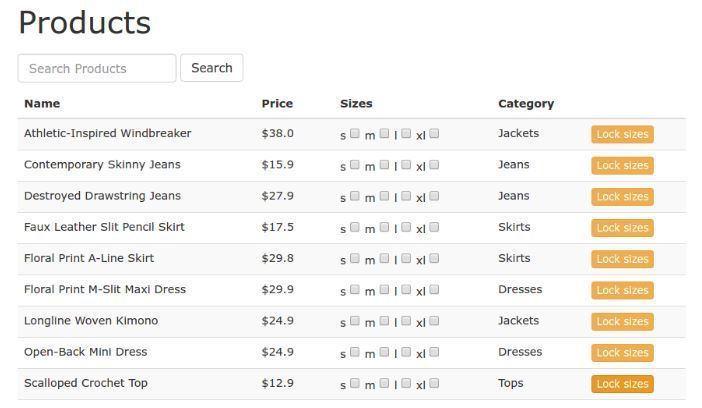
Steps to lock a clothing size:
- Check the checkboxes in a row.
- Click the button “Lock sizes” in the same row.
- The last updated record should be shown in the top of the products list.
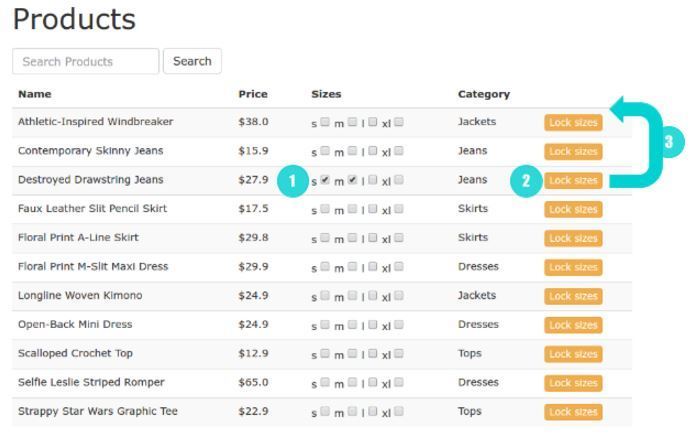
Problem to solve?
After clicking the “Lock sizes” button, the chosen clothing type (“Destroyed Drawstring Jeans”) is shown on the top of the list, but checkboxes are unchecked again. This means we made a mistake somewhere in our code and our record is not saved properly to the database. We’ll find out why by using cool Rails debugging tools.
Let’s dive into the code and see how this page works. Here is the view with the table containing the clothes.
Inside the body we render partial _product_list.html.erb
The code for locking clothing sizes is in the ProductsController.
lock method reads params, which we send using javascript lock_sizes() method by clicking on the button “Lock sizes”.
lock_sizes() method looks like this:
We pass the product_id to the method, look for checkboxes with class containing the sent product_id and create hash sizes with info about the locking sizes. Using console.log(sizes) in the lock_sizes() method we can see hash content:


After that, we send an ajax request to the lock method in the ProductsController with product id and previously created sizes hash. Then, in the controller lock method we update the locked_by_size field in the database for a product and re-render product_list with new products by sending the partial to the html element.
However, there aren’t any error messages. Therefore, we need to review logs.
When our server still is running in the console, we can get the following output:

What does logs tell us?
What kind of request did the server receive and which controller action was invoked? In our case, there is lock method in the ProductsController. We can see parameters sent to the method and many queries executed by the controller. Logs also inform us about ran scripts (lock.js.erb) and rendered views (partial view _product_list.html.erb).
Active Record Backtrace SQL Queries Plugin
If the information about queries isn’t clean enough, we can use the active record-backtrace-sql-queries plugin. It’s helpful to track down where queries are being executed in application.
Add the module to lib/query_tracer.rb
Now we only need to require the module from the initializer. Add the code below to the config/lib/query_tracer.rb and restart the server.
In the console, we get additional logs sources of SQL queries. It helps to avoid going through your code looking for the location of a problem, and we are now able to see exactly where queries are performed.
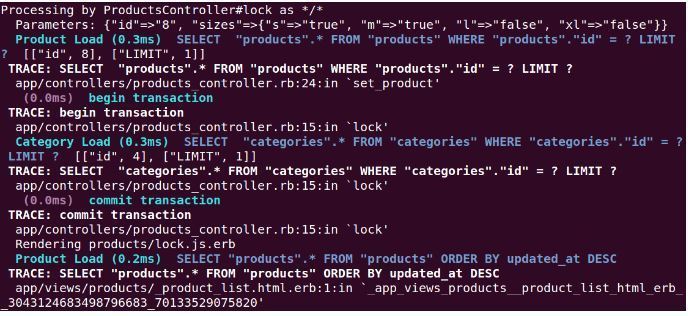
At first glance the parameters are sent properly. So why we can’t save the record?
The Logger
A very useful Rails feature is the capability to save information to log files at runtime that you can use to output messages. However, it can be very difficult and time consuming to debug full error logs in the production environment when application logs are choked by many irrelevant messages.
Please note that in production mode, you need to specifically switch logging to debug in order to see detailed information. Luckily, we can easily configure logging. Rails has a separate log file for each runtime environment, and I will give you a few tips how to use it.

In the config/application.rb or any other environment file you can change the configuration for logging.
To specify a logger:


To set the log level:
![]()
Log messages are saved into the respective log files depending on log level, and only messages at that level or higher will be printed. The are six available log levels:

For example, as a developer, you will probably want to know the internal program state. In this case you should set the Logger to :debug level. However, in a production system, you should use :info.
To write a log message with an explicit level:
![]()
There is the configuration I used for our application:
We don’t really need to set the log level to :debug, because it’s set by default in all environments.

In the config/environment.rb add the code below:
When we run the server the output we get:

Logger’s level is set to :debug so all messages are printed. For instance, if we use :warn level only warning, error and fatal messages will be recorded, as they have an equal or higher level.
Logger provides a few cool features. One of them is setting the format of log messages.
Add formatter to the config/environment.rb
Now, after restarting the server and viewing the index page, we see formatted logs that give us additional information about time, date and a log level.
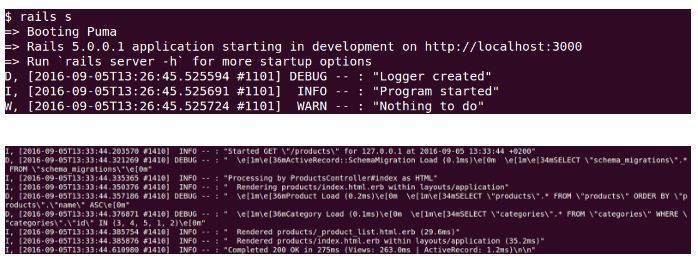
Let’s now use Logger in the ProductsController lock method!
So far, we only knew there was something wrong with saving records to the database. A wise decision would be to check the state of the chosen product before and after an update. To do that, we won’t need to format logs, so for now we will comment it.
Add 4 and 6 lines to the lock method.
We can use logger.debug instead Rails.logger.debug because our class inherits it from ActiveRecord.
Inspect method is one of views that helps generate human-readable data from any object. Other ways to inspect the object are to_yaml and debug methods.

In the console, we see our added messages.
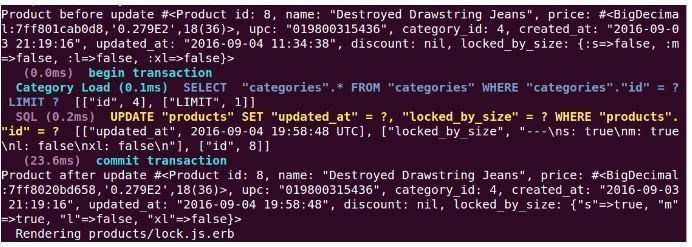
As you can see, there are differences in the locked_by size field type. We finally found the source of the bug! The problem is that we don’t convert string to symbol in the locked_sizes_hash. That’s why we can’t overwrite this data in the database. What we need to do now is add to_sym method in the lock method.
Change the lock method:
Run Rails console and update all product to the initial state:

Then restart the server and try to lock a product size in the browser. Now locked_by_size field type is the same as before and after update.
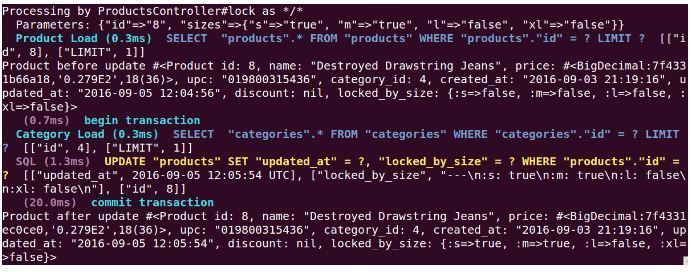
We see that the data has been saved correctly.
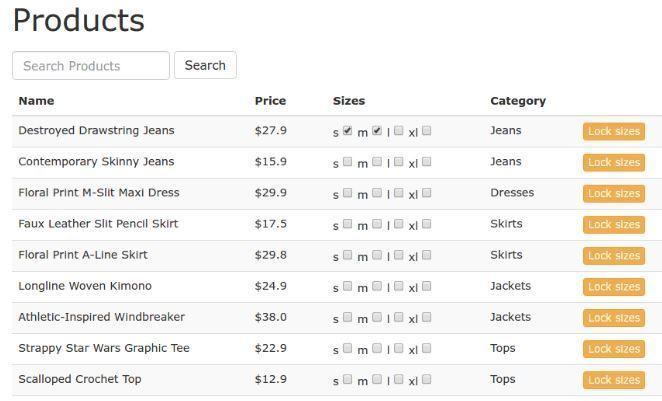
Congratulations! You found and fixed the bug!
You now know how Logger works. Let’s find out how to use another useful Rails debugging tool.
When your code is behaving in a way you don’t expect it to, it may take too much time printing to the console and looking for the source of the problem. If you want to overview inside of your code while it executes, a better choice would be using a debugger.
I’m going to show you two easy to use debuggers: Byebug and Pry-Byebug.
Debuggers offer many useful commands. Here are the most common kinds:
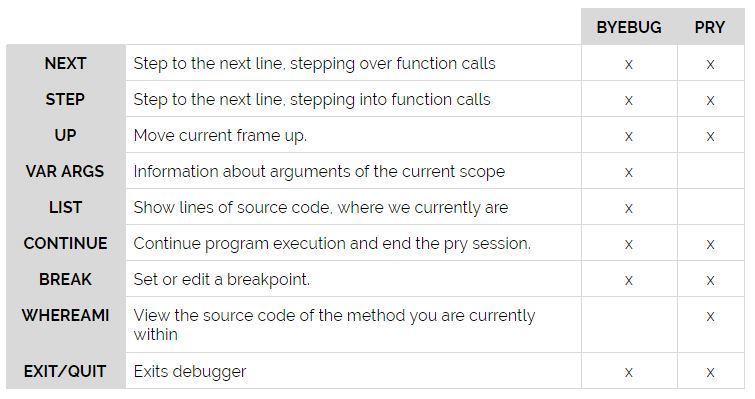
To get a list of commands, or information about a specific command, you can always use help in the console.

Byebug
Byebug is the default debugger in Rails >= 4.2.0. If you use a lower version to install byebug, use command, and then restart the server if it’s running.
gem install byebugYou can add byebug method anywhere in your code. The execution will stop there, and you will be dropped into a debug console.
Let’s add byebug to our lock method.
When you use lock method execution stopping at the point, the byebug will set, and you will be dropped into an interactive shell.

We start to check if the parameters passed to the lock method are permitted.
![]()
It returns false and indicates that there is something wrong. Use params to print all content.

Let’s try to find out what’s going on.
Byebug gives us the ability to inspect variables. When we write locked_sizes_hash in the console, we get a nil. Why? Because the line we assign the data to the variable isn’t executed yet.
The arrow points to the line of code which will be executed next.
Type next in the console and then use the locked_sizes_hash variable.
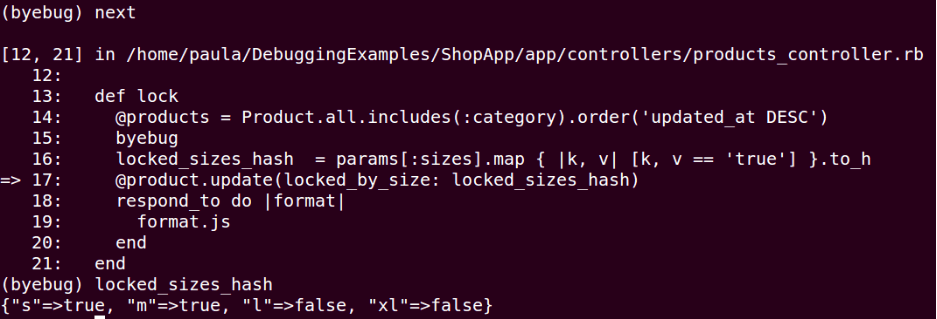
The arrow points to the line below it and we have an access to the hash content. We can also check the state of the @product variable before saving changes to the database, as we’ll set it before calling the lock method. We can run any Ruby code here, so let’s print only the locked_by_size field.

Before the update, data had an initial state. We can go into methods using the step command. It’s really useful when you run your own methods. That way, you can inspect the variables inside.
Type step and then run var args to see arguments passed to the update method.

If you want to go back to the previous frame type up. By running the list method, we get information of where we currently are.

Use the next method again to update the @product and inspect the locked_by_size field that belongs to the @product.
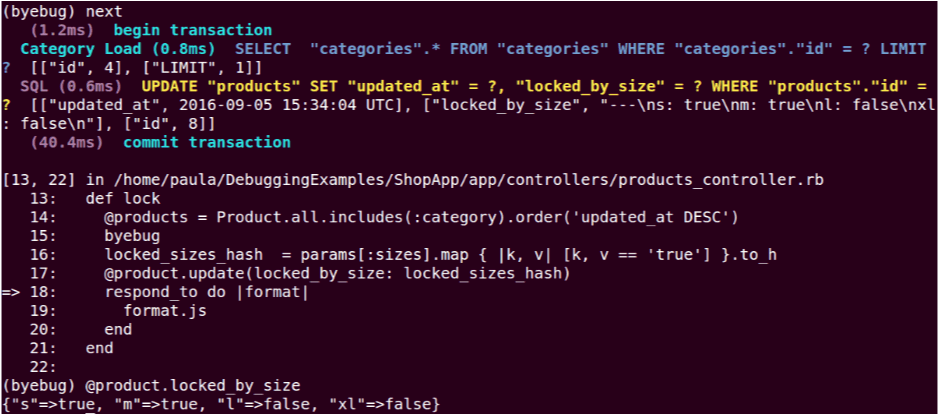
Great! We found the bug again by using Byebug debugger!
To stop debugging, just run quit command.
Pry-Byebug
The basic setup of Pry-Byebug is as simple as installing byebug.
Add gem ‘pry-byebug’ to the Gemfile and run bundle install in the console.

After successfully installing the gem, use binding.pry command in our lock method.
Then restart the server, if it’s still running. Execution will stop in the first statement after the command.

As you can see, Pry-Byebug compared with Byebug colors the syntax, but it’s almost the same.
First, we will check parameters sent to the lock method.

We get ‘false’ again. This time, we will try to set a breakpoint to stop the code execution at the desired location, instead of executing line by line using next method.
Type break [number]. The number indicates a number of a line. In this case it’s break 17.

Let’s inspect the locked_sizes_hash variable by typing it in the console. We get a nil because we still didn’t assign anything to the variable.
Run continue method.

As you can see, the execution was stopped in the 17 line, and we can now get the hash content.
The next step will be inspecting @product before call an update method. Check the lock_by_size field that we’re interested in.
![]()
We have a hash that consists of symbols and boolean values.
Run step command to get into the update method. Pry-binding doesn’t support var args as byebug does, so to check the passing data, we type the name of the method attributes.
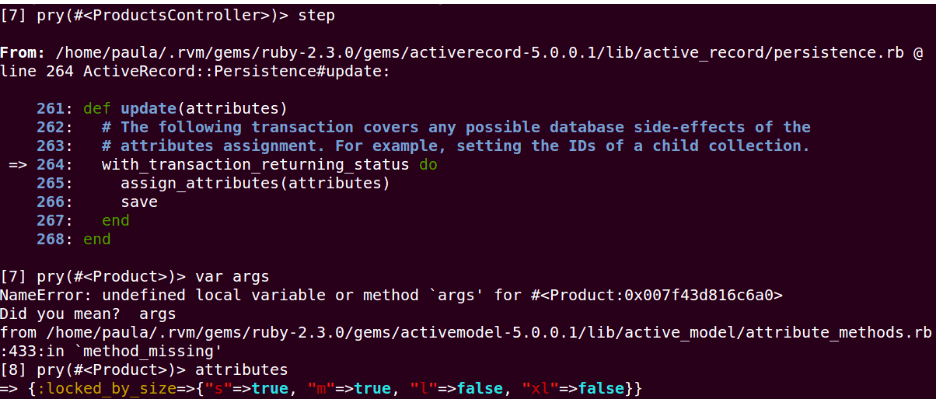
Data we pass to the function will have strings instead of symbols. We can guess that our @product won’t be updated properly.
If we don’t know where we currently are in a code, (for example: we run too many commands and we don’t see the exact code) using the whereami command is very handy. View the source code of the method you are currently within.

Come back to the previous method using up command, and check the state of the locked_by_size field again.

As we thought, the locked_by_size field was saved with the wrong data. The good thing is that you know how to use the Pry-Byebug debugger now, and you fixed the bug one more time!
You’re very persistent if you managed to get to the end of this post. 🙂 I hope this tutorial was useful for you Thank you for following along and happy debugging!


